ComputerCraft is one of those mods I just have to have. It, especially when combined with peripheral mods such as Computronics or Plethora, is insanely powerful. Whilst this is fantastic for single player, it introduces all sorts of problems on servers: a single misbehaving computer can grind things to a halt.
Most of the time this doesn’t become an issue, as usage of ComputerCraft is seldom. However, there are some servers where CC is a key mod, and so is used (and misused) a lot more frequently. Finding these issues can become quite problematic: most tools (such as /forge track) do not identify computers, as all the “interesting” stuff is happening in a different thread. Over the last few months, I’ve been putting together some tools which help somewhat with tracking down these problems:
Tracking computer timings
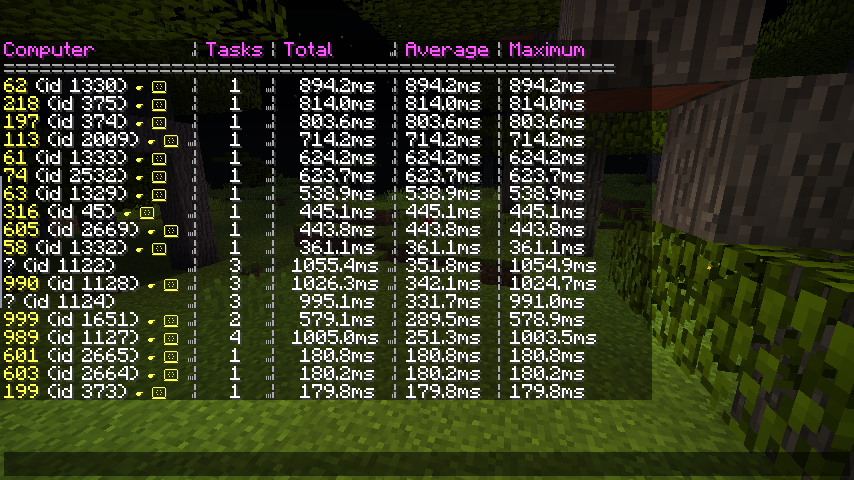
The /computercraft track command works rather similarly to Forge’s command of the same name. When turned on, it times how long every computer executes for. When tracking is stopped, the most resource-intensive computers are displayed in a table:

A computer’s execution is split into “tasks”. Every time something happens (a user presses a key, a redstone signal is changed, etc…) a task is created and run. We can simply time how long each task takes to run, add them all up, and display the results in a table.
As ComputerCraft generally runs all computers on a single thread1, you want to keep the duration of each tasks’ execution as short as possible. If one computer starts taking 200ms to process every event, you’ll start seeing massive latency on other computers. Consequently, we also report the average and maximum time each computer runs for. It’s technically possible to run a computer for 10 seconds before being interrupted: during that time no other computer can do any work.
Once you’ve identified problematic computers, there are buttons to teleport to that computer, as well as being able to remotely interact with it.
Tracking other information
While determining how much time computers spend running is incredibly useful in our quest to find misbehaving computers, it isn’t the be all and end all. Computers may do all sorts of other things, such as making HTTP requests, reading and writing files, as well as interacting with peripherals.
Of course, none of these are especially bad on their own, but they all have a small impact on performance, which can quickly add up to a larger problem over time. Peripherals are especially problematic, as it’s incredibly easy to write code which interfaces with them more than necessary. This is problematic as this results in lots of work being done on the server thread, having a direct impact on TPS.
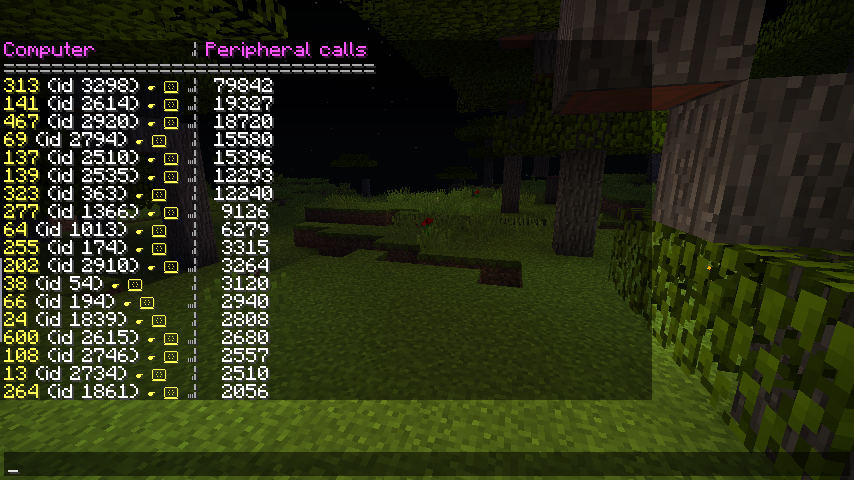
The aforementioned track command also monitors the above information, counting the number of peripheral calls, the amount of server-thread time each computer consumes, and more. While these numbers are less “absolute” than the timing information, they’re still useful in identifying problems.

Prometheus school of graphing things (with Grafana)
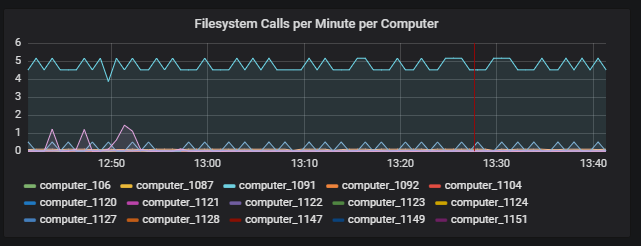
One of the more dubiously useful features we added was an exporter for Prometheus. This effectively hosts a small service containing all of the above information, which is then queried periodically. This makes it possible to observe resource usage over a longer period. More importantly, it allows us to produce insanely beautiful graphs through Grafana.

While it’s mostly there to look pretty (it’s so satisfying watching the numbers go up and down), being able to see how various statistics are correlated and change over time does prove useful. For instance, are lag spikes correlated with a spike of activity from a particular computer?
So, is this actually helpful?
Maybe.
In most cases of server lag, there isn’t one Horrible Evil Block which is responsible for all the problems, it’s rather death by a thousand paper cuts, with everyone bringing their own problems to the party. It is just the same with ComputerCraft - most programs aren’t as optimal as they could be, but they’re not so bad that they stand above any of the others.
That being said, there have been plenty of cases where we have been able to blame a single computer for acting up. One recent incident involved a badly written program making HTTP requests in an loop, resulting in a large amount of incoming network requests. We were able to identify the computer, and thus rectify the problem pretty quickly2.
Other times, it’s less clear cut. In the peripheral calls screenshot, you can see one computer was making 4 times as many peripheral calls as any other. This is definitely a badly written program (it was redrawing a monitor far more often than was needed), but wasn’t really contributing to lag at all.
Closing thoughts
Some of you are probably thinking “Why not just rate limit things?”. You’re right, and it’s definitely something we’re investigating. However, ComputerCraft already imposes some limits (such as task execution time) and they definitely don’t prevent all forms of abuse. Ideally we’d be able to stop most problems arising, while still being able to dig out the various analysis tools if something crops up. While this is becoming less of a pipe dream as time moves on, it’s not something which is there quite yet.
Of course, the really astute are wondering why we don’t just use OpenComputers.
No blog post is without a shameless plug: if this interests you, you should check out CC: Tweaked. It’s a fork of ComputerCraft with a large number of new and experimental features. This includes all the above monitoring tools, as well as a a whole host of performance and stability improvements over vanilla ComputerCraft.
CC: Tweaked adds experimental support for running computers on multiple threads. It’s beeen running on a few servers, and it definitely helps ComputerCraft feel more smooth, but can cause all sorts of problems with peripherals which don’t like it.↩︎
Interestly, we weren’t actually monitoring HTTP requests at this point. Thankfully, the computer was writing the requests to disk, allowing us to correlate the network traffic with a computer.↩︎
