
I’ve just pushed CC:Tweaked 1.80pr11, which is mostly a bug fix update. While most of the bugs are pretty boring (and rather embarrassing), there’s one bug which has a far more complex story of debugging and fixing.
In preparation for this release, we updated SwitchCraft to use a development build of CC:T, just to see how stable it was. Unfortunately, the answer came all too soon, as SwitchCraft crawled to a halt.
Due to some other changes, some wireless modem code was now being called far more frequently than before. The function in question acquired a lock, added of removed something from a collection, and released the lock. However, this function would be called both on the main thread, and by several computers off-thread. The main thread would spent an awful lot of time waiting for other threads to finish, and so lagging the sever.
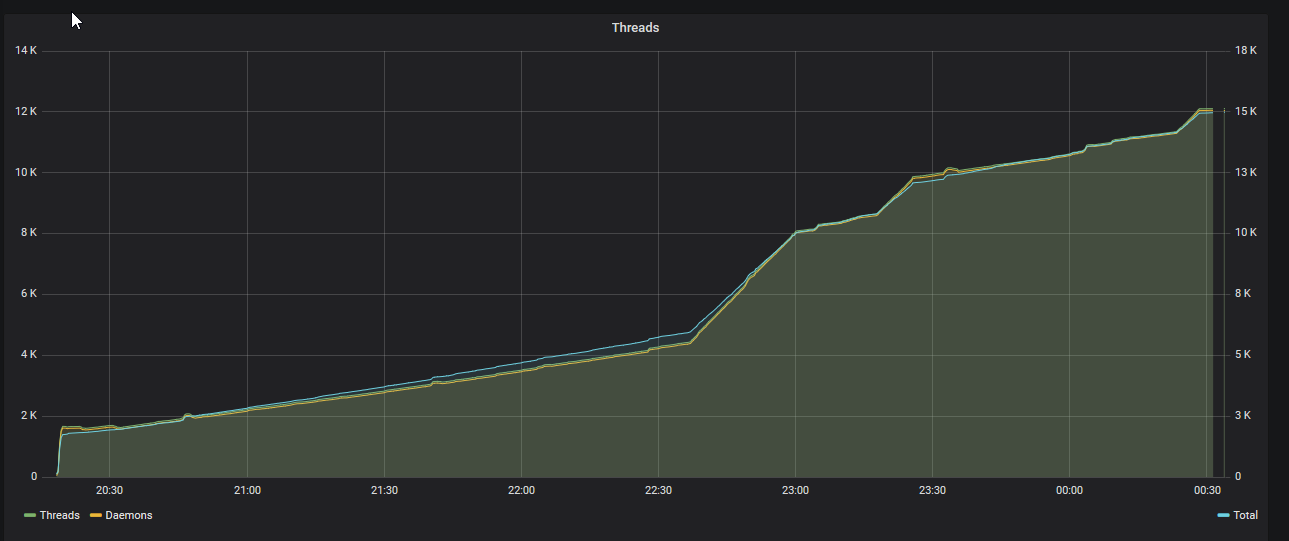
While we were able to fix this quite quickly (it turned out the lock wasn’t really needed), we started having other issues - somehow, Java had created far too many threads, and so was unable to execute critical tasks. We didn’t previously keep track of how many threads the JVM was using, but after adding that, we were able to see there was a bit of a problem.
While the number of “live” threads was pretty steady, the total number of threads ever created was growing. Rapidly. In fact, the JVM was creating, and then promptly destroying, 50 threads per second. The obvious solution here was to pool the threads: instead of creating and destroying them, we can take a thread from the pool, use it to run some Lua, and then return it once finished. This means you only need to create new threads when the pool is empty.
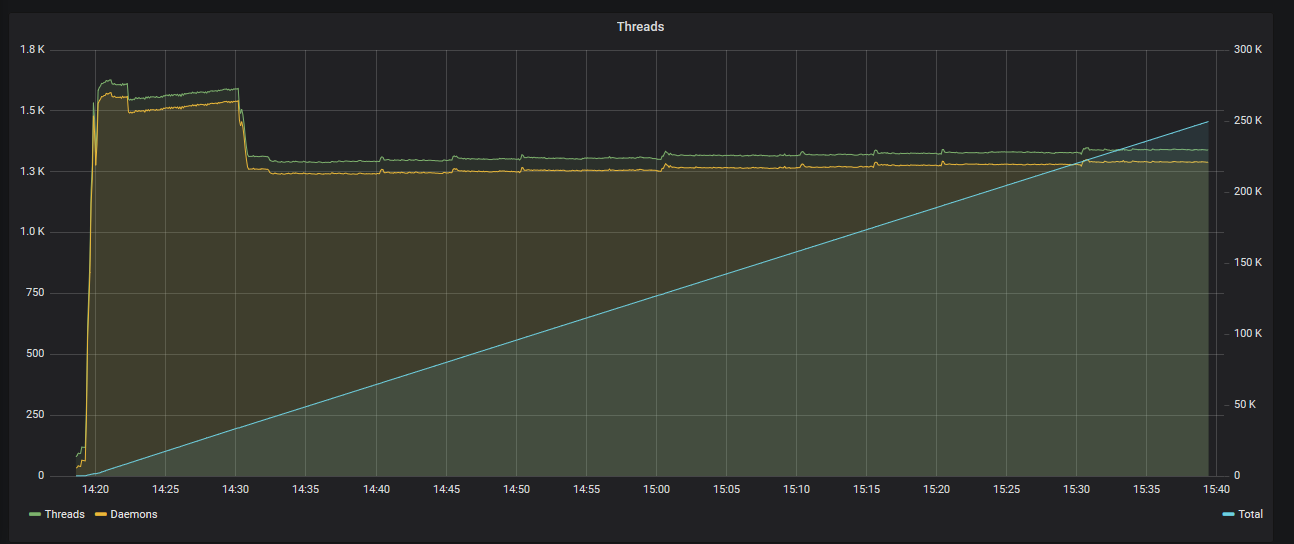
A couple of modifications to Cobalt later, and we had a graph which looked a little more reasonable.
The total number of threads looks far more healthy, but the number of live threads never goes down! The thread pool was set to evict threads which hadn’t been used for a while, so something else was going on. It turns out, computers were not correctly cleaning up their coroutines when they shut down. We had a couple of computers which were stuck in boot loops, which only exacerbated the problem. Thankfully this was trivial to fix, leaving us with a graph which looks much more sane.
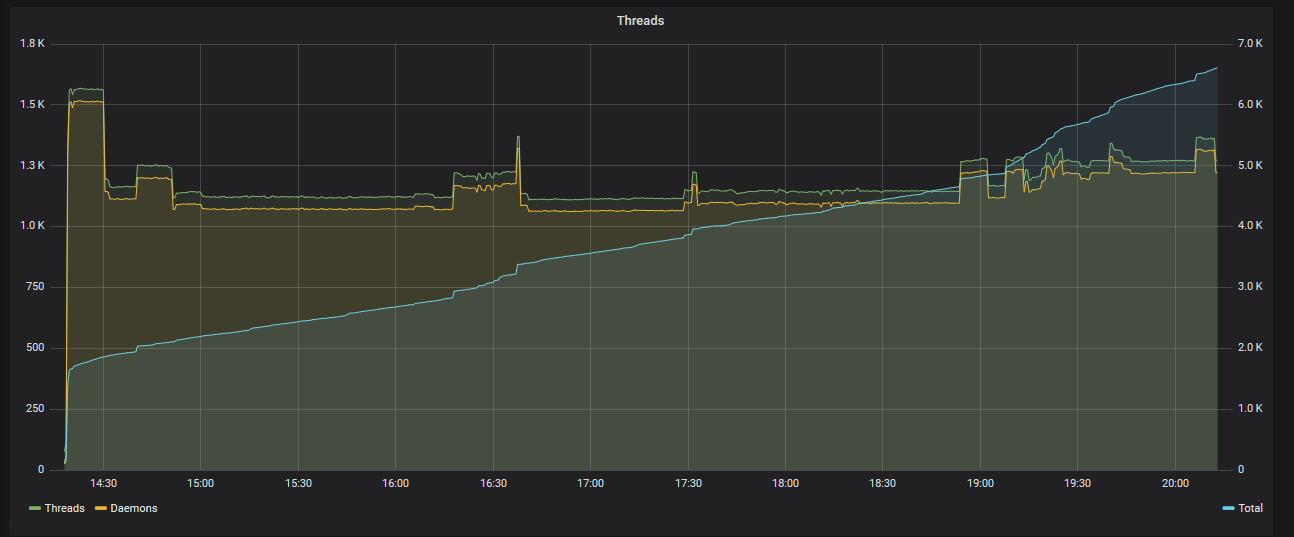
Ideally in the future, we would be able to move Cobalt to use one thread for all coroutines, which would substantially reduce the number of threads used (of the server’s ~1.2k threads, ~1.1k are created by ComputerCraft), however that is still a way away. This’ll have to do for now…1
I’m sure there was a point for me writing this massive wall of text, but it eludes me. I hope somebody maybe finds this a little bit interesting :).
This was later implemented, see this post for details.↩︎